Table of Contents
Introduction
My M.Sc project aimed to develop a scoring function for detecting differentially expressed genes (DEGs) using RNA-Seq data. I was motivated by the abundance of existing packages and resources for DEG analysis and wanted to investigate the differences between the most popular methods, compare their results, and determine the optimal approach for identifying DEGs. To achieve this, I utilized a novel dataset focused on drought resistance in the ryegrass species Lolium perenne to test the various DEG detection packages and optimize the methodology. Through this project, I was able to contribute to the important field of crop agriculture while improving the accuracy and efficiency of DEG analysis.
RNAseq, DEGs and R pacakges for data analysis
RNA sequencing (RNAseq) is a popular method for measuring gene expression levels in cells or tissues, and RNAseq data analysis involves various steps, including quality control, alignment, quantification of gene expression, differential gene expression analysis, and functional enrichment analysis. Differential gene expression analysis identifies differentially expressed genes (DEGs), which are genes that show significant changes in expression levels between two or more conditions. DEG analysis can provide valuable insights into gene regulation, discover novel transcripts, and identify potential biomarkers for disease diagnosis and treatment. DEG analysis involves several steps, including read alignment, quality control, normalization, and statistical testing, and there are several software tools and packages available for each step.
For this project, the focus was on the normalization and statistical testing stages of DEG analysis, with read alignment and quality control being performed ubiquitously throughout the analysis. The selection of the appropriate tool depends on various factors, such as study design, sample size, distribution of expression data, and desired level of sensitivity and specificity.Three widely used packages, edgeR, DESeq2, and limma+voom, were selected along with a less conventional package, baySeq, for comparison:
-
edgeR: edgeR (Empirical analysis of Digital Gene Expression in R) is a software package used for the identification of differentially expressed genes in RNAseq datasets. It uses a negative binomial model and empirical Bayes estimation to estimate the dispersion parameters and gene-wise dispersion estimates. This package can be used for single-factor or multi-factor experimental designs.
-
DESeq2: DESeq2 is a R package that can be used to analyze differential gene expression in RNAseq experiments. It uses the negative binomial distribution to model count data and provides methods for estimating size factors and dispersion parameters. DESeq2 also provides methods for normalizing data, performing hypothesis testing, and visualizing results.
-
limma+voom: limma (Linear Models for Microarray Data) is an R package that can be used to analyze differential gene expression in RNAseq datasets. It uses linear models to analyze differential expression and provides a range of functions for data normalization and visualization. The voom (Variance modeling at the Observed Mean) function in limma can be used to transform count data into log2-counts per million (logCPM) values, which can then be used with limma for differential expression analysis.
-
baySeq: baySeq is a software package for analyzing RNAseq data using Bayesian methods. It can be used to identify differentially expressed genes, quantify expression levels, and estimate the probability of differential expression. baySeq models count data using a negative binomial distribution and provides a flexible framework for incorporating prior information about gene expression.
Jury vote function to determine DEGs
I decided to design a jury vote function that could incorporate the results from the four previously described DEGs packages (edgeR, DESeq2, limma+voom, and baySeq) with the following criteria:
-
- For each gene, I calculated the p-value of differential expression for each package, using the recommended or default settings for each one.
-
- I applied a multiple testing correction to the p-values, such as the Benjamini-Hochberg or Bonferroni correction, to control for false positive results.
-
- I identified the genes that have a significant p-value after multiple testing correction, using a chosen significance threshold (e.g., FDR < 0.05).
-
- I ranked the genes based on the significance of their p-value for each gene/package, from most significant to least significant.
-
- I assigned a weight to each gene based on its rank, such that DEG is assigned with a value of 1 or 0 otherwise.
-
- I calculated a weighted average score for each gene, using the assigned weights. This would result in a single, combined score for each gene.
-
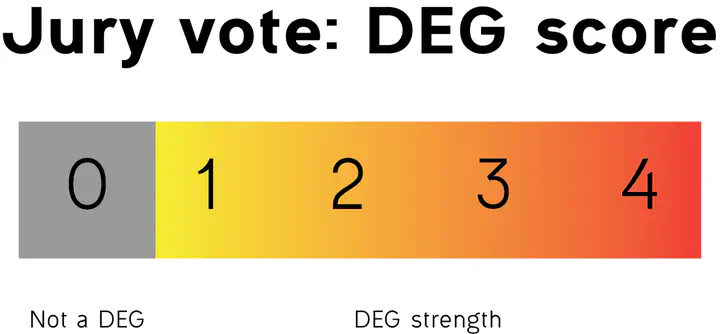
- I used the score to determine the strength of DEGs
This way, this jury vote function takes into account the results from multiple packages and weight them based on their relative performance, being a more robust and reliable identification of differentially expressed genes.

It also gives the flexibility to decide whether you want to maximize your results (taking any DEGs in any package, score of 1) or get a subset of very reliable, robust results (taking only DEGs in all packages, score of 4).
Case of study: Drought resistance in perennial ryegrass
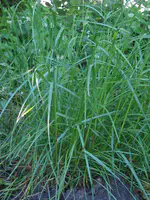
Lolium perenne, commonly known as perennial ryegrass, is a cool-season grass widely used in temperate regions for forage production, turfgrass, and erosion control due to its rapid establishment, high productivity, and quality. In addition, L. perenne has gained interest as a model species for studying abiotic stress tolerance, particularly drought resistance.
Drought is a major environmental stress that affects plant growth and productivity, and its impact is expected to increase with climate change. Therefore, understanding the molecular mechanisms underlying drought resistance is crucial for developing more resilient crops. L. perenne has several advantages for studying drought resistance, such as its ability to survive and recover from drought, its relatively small genome size, and the availability of genetic resources and tools.
Overall, L. perenne is a valuable species for studying drought resistance and developing more resilient crops. Its use as a model species for abiotic stress research has the potential to improve our understanding of the molecular basis of stress tolerance and aid in the development of new crops with improved resilience.
RNAseq was collected from L. perenne root and leaf tissue at different soil water content; 35%, considered a regular condition (no stress) and 15%, 5%, and 1%, increasing stress conditions.
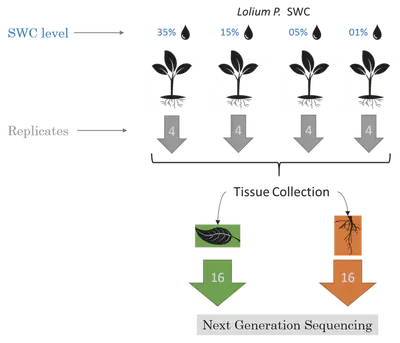
Then, I used the previously described jury vote sytem to determine the DEGs.
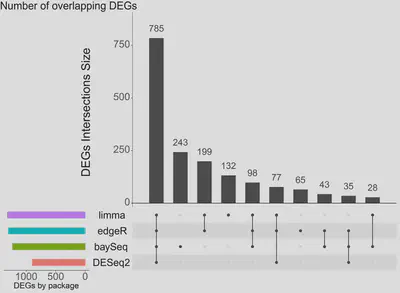
The results of the analysis showed that edgeR, DESeq2, and limma+voom had a similar performance in terms of identifying differentially expressed genes (DEGs), as evidenced by the low number of DEGs unique to each package. However, BaySeq yielded a higher number of DEGs using its own methodology.
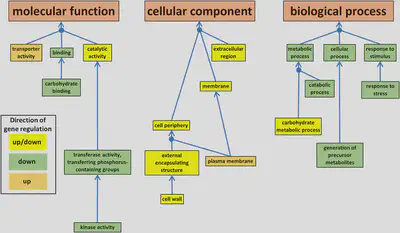
In addition to comparing the packages, we also conducted a functional analysis to investigate whether the genes associated with drought conditions were functionally related. The results of the functional analysis provided valuable insights into the mechanisms by which L. perenne adapts to drought conditions.
Conclusion
RNAseq is a powerful tool to measure gene expression levels and identify DEGs between different biological conditions, such as different tissues, cell types, developmental stages, or disease states. The RNAseq data analysis pipeline includes several steps, such as quality control, alignment, gene expression quantification, normalization, and statistical testing for differential expression analysis. Several packages and tools are available for each step, and the choice of appropriate methods is crucial for obtaining reliable and biologically meaningful results.
In this study, we compared the performance of four popular DEGs analysis packages (edgeR, DESeq2, limma+voom, and BaySeq) for the identification of drought-responsive genes in the ryegrass Lolium perenne. We found that the three most widely used packages (edgeR, DESeq2, and limma+voom) performed similarly, while BaySeq identified a larger number of DEGs using its own methodology. We also conducted functional enrichment analysis to gain insights into the biological processes and pathways involved in the drought response in L. perenne.
Overall, our study demonstrates the importance of carefully selecting appropriate methods and packages for RNAseq data analysis and highlights the potential of RNAseq technology for identifying novel genes and biomarkers related to complex biological processes such as drought adaptation.